The axial-load design case is the easy one. A pile, stood up vertically, pushes down on the ground. Capacity = shaft friction + end bearing. Every junior engineer learns it in their first tutorial.
The lateral case is where pile designs fail — sometimes spectacularly. Sound walls topple. Light poles lean. Crane pads rotate. Bridge piers migrate. All of these failures are lateral-load failures dressed up as other things. This article sets out how lateral pile analysis actually works, what p–y curves are, and the numbers you need from your geotech report to run a real analysis.
The problem with a lateral load on a pile
An axially-loaded pile is a 1-D problem: resolve force through the shaft and toe, done. A laterally-loaded pile is a 2-D problem in which two different physical systems interact:
- The pile as a Bernoulli beam — EI resisting bending, material yielding in accordance with its moment-curvature behaviour.
- The ground as a non-linear spring — resisting sideways movement of the pile at every depth, with a load-deflection relationship that depends on depth, soil type, soil strength, pile diameter and previous loading history.
The simplest representation of the ground reaction is a linear spring, k_h × y × pile diameter, where k_h is the “modulus of horizontal subgrade reaction”. This gives you the classical Hetenyi solution — closed form, elegant, and wrong for anything but very small deflections.
Real soils are non-linear. At small deflections they behave almost elastically. At deflections comparable to 5–10% of pile diameter, they yield and stop taking more load. A correct lateral pile analysis has to capture both regimes.
What a p–y curve actually is
A p–y curve is a plot of the lateral resistance per unit length of pile (p, in kN/m) against the lateral displacement at that depth (y, in mm). Every depth has its own curve. The curves are non-linear — typically initial slope then a plateau. They depend on:
- Soil type — clay, sand, rock have fundamentally different shapes.
- Soil properties at that depth — undrained shear strength for clay; angle of friction and density for sand; UCS for rock.
- Pile diameter — larger pile = larger lateral resistance at the same displacement.
- Depth below ground surface — deeper = larger resistance (more overburden confines the soil).
- Proximity to free face — near the surface, less resistance than expected because there is nothing on one side to push against.
- Cyclic vs static loading — cyclic loads reduce peak resistance, especially in soft clay.
The standard reference p–y curve formulations, each developed from instrumented full-scale pile tests:
- Soft clay above the water table (Matlock 1970) — the classic “Matlock soft-clay” curve, calibrated on instrumented tests in Sabine Lake, Texas.
- Stiff clay below the water table (Reese et al. 1975) — includes post-peak strength reduction with cyclic loading.
- Sand (Reese et al. 1974; O’Neill and Murchison 1983) — angle-of-friction based, API-style.
- Rock (Reese 1997) — UCS-based hyperbolic curves for weak rock.
All of these are in the public domain, they’re built into every commercial lateral-pile program (LPILE, GROUP, PLAXIS, RS-Pile), and they are the starting point for tier-1 civil design.
How to run a real lateral-pile analysis
A competent lateral-pile analysis package looks like this:
-
Pile geometry. Length, diameter, section properties (A, I, EI) along the length. For a reinforced concrete pile, EI is not constant — it changes with cracking at ultimate state. Use a moment-curvature analysis for the pile section.
-
Load cases at the pile head. Axial load N, lateral load H, applied moment M at the pile head. Usually given by the structural engineer. Don’t forget load combinations — wind, seismic, dead+live, crane operating, crane out-of-service etc.
-
Boundary condition at pile head. “Free head” (no rotational restraint) or “fixed head” (pile built into a rigid cap). Fixed-head is usually more accurate for foundation piles in a cap.
-
Soil profile with p–y curves at each depth. From the geotech report: unit weight, undrained shear strength (clay), SPT N or φ’ (sand), UCS (rock). Every 0.5 m of depth is typical resolution. See reading a geotech report for piling.
-
Run the finite-difference or finite-element solution. The program iterates the pile deflection at each node until force and moment equilibrium are satisfied at every depth. Outputs: deflection profile y(z), bending moment M(z), shear V(z), mobilised soil pressure p(z).
-
Check against pile capacity. Peak moment vs ultimate moment capacity of the pile section (concrete + reinforcement, or steel). Peak shear vs shear capacity. Maximum deflection vs serviceability limit (typically 10–25 mm at head, project-specific).
The numbers your geotech report MUST contain
If the geotech report doesn’t give you these, you can’t run a lateral analysis. Send it back and ask for them:
| Depth zone | Soil type | Required parameters |
|---|---|---|
| Any | Clay | c_u (undrained shear strength), γ (unit weight), ε_50 (strain at 50% of peak stress) |
| Any | Sand | φ’ (angle of internal friction), γ, relative density or SPT N, k (initial modulus) |
| Any | Rock | UCS (unconfined compressive strength), γ, RQD, E_m (mass modulus) |
The parameter engineers forget most often is ε_50 for clay. It controls the initial stiffness of the Matlock p–y curve. Default of 0.02 is commonly used, but stiff overconsolidated clays can have ε_50 as low as 0.005, and soft normally-consolidated clays can reach 0.02–0.03. Getting this wrong changes the calculated deflection by a factor of 2.
Typical results — what you’re looking for
For a typical 600 mm diameter reinforced concrete bored pile, 10 m long, in medium-stiff Melbourne clay with a lateral load of 150 kN and 0 kNm applied moment at the head:
- Deflection at head — 8–14 mm.
- Maximum moment — 350–500 kNm, at a depth of 2–3 pile diameters (so 1.2–1.8 m below ground surface).
- Depth of fixity — 4–5 pile diameters (so 2.4–3.0 m). Below this depth the pile is essentially undeflected.
The “depth of fixity” concept is useful: below it, the pile is doing nothing lateral. This means extending a laterally-loaded pile deeper does almost nothing for lateral capacity. If you need more lateral resistance, make the pile stiffer (bigger diameter or higher EI), not longer.
Group effects on laterally-loaded piles
Close-spaced piles shadow each other when loaded laterally. The leading row carries more load; trailing rows see reduced soil resistance because the soil has already yielded in the leading row’s path.
Typical p-multipliers (applied to the single-pile p–y curve) for various rows:
| Spacing (in pile diameters) | Leading row | Middle row | Trailing row |
|---|---|---|---|
| 3d | 0.8 | 0.4 | 0.3 |
| 4d | 0.9 | 0.5 | 0.4 |
| 5d | 1.0 | 0.7 | 0.7 |
| 6d | 1.0 | 0.85 | 0.85 |
| 8d+ | 1.0 | 1.0 | 1.0 |
Reese, Isenhower & Wang (2006) and Brown et al. (2001) tabulated these values from full-scale pile-group tests. For crane pads and transmission-line foundations (4–6 pile groups), ignore group effects at your peril — the actual capacity can be 30–50% lower than the sum of single piles.
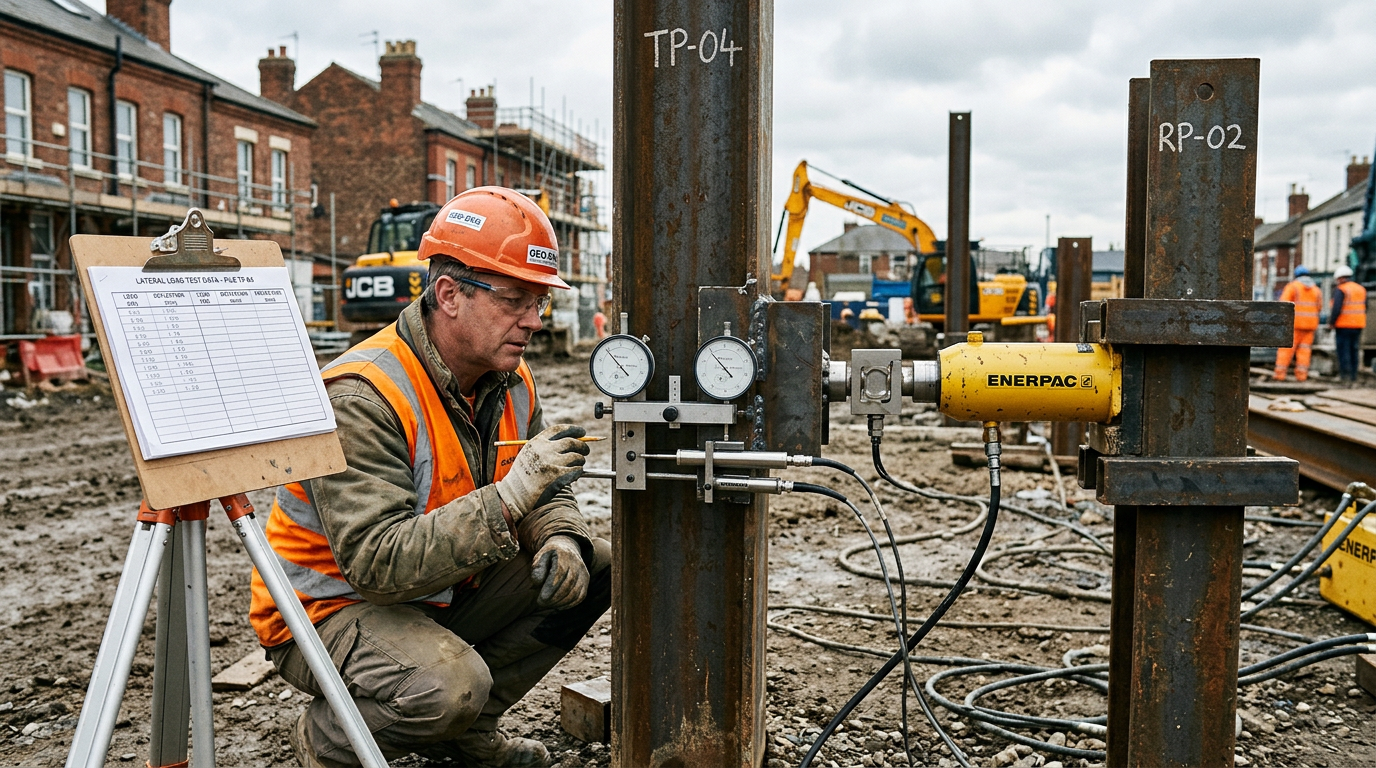
Verification — lateral load testing
Static lateral load tests are specified on tier-1 lateral-load-critical projects. A typical setup (illustrated in the hero photograph of this article) is a horizontal hydraulic jack between two test piles — one pushes, the other reacts. Dial gauges or LVDTs measure head deflection at sub-millimetre resolution. Load is applied in increments, held, then reversed.
Acceptance criteria are typically:
- Working-load deflection ≤ specified SLS limit (commonly 10–15 mm).
- Ultimate test to 150% of design load, no excessive creep.
- Unload to zero, measure residual deflection (indicator of soil yielding).
Results are back-analysed against the p–y model. If measured deflections exceed predicted by more than ~30%, the p–y model is recalibrated and the design is revisited.
Why this matters on site
Because designers who never ran a p–y analysis tend to over-specify in the axial direction and under-specify in the lateral direction. A 900 mm pile at 20 m with enormous axial capacity will still topple under a modest wind load if its lateral stiffness wasn’t checked. Every pile that goes into the ground at VIC PILING on a tower, crane pad, sound wall or cantilevered bridge pier has a lateral analysis backing it — because we’ve seen the failures.
References
- Reese L.C., Isenhower W.M., Wang S.-T., Analysis and Design of Shallow and Deep Foundations, Wiley, 2006.
- Brown D.A., Morrison C., Reese L.C., Lateral Load Behavior of Pile Group in Sand, Journal of Geotechnical Engineering, ASCE, 1988.
- Matlock H., Correlations for Design of Laterally Loaded Piles in Soft Clay, Offshore Technology Conference, 1970.
- Reese L.C., Cox W.R., Koop F.D., Analysis of Laterally Loaded Piles in Sand, Offshore Technology Conference, 1974.
- API RP 2A-WSD, Recommended Practice for Planning, Designing and Constructing Fixed Offshore Platforms, American Petroleum Institute.
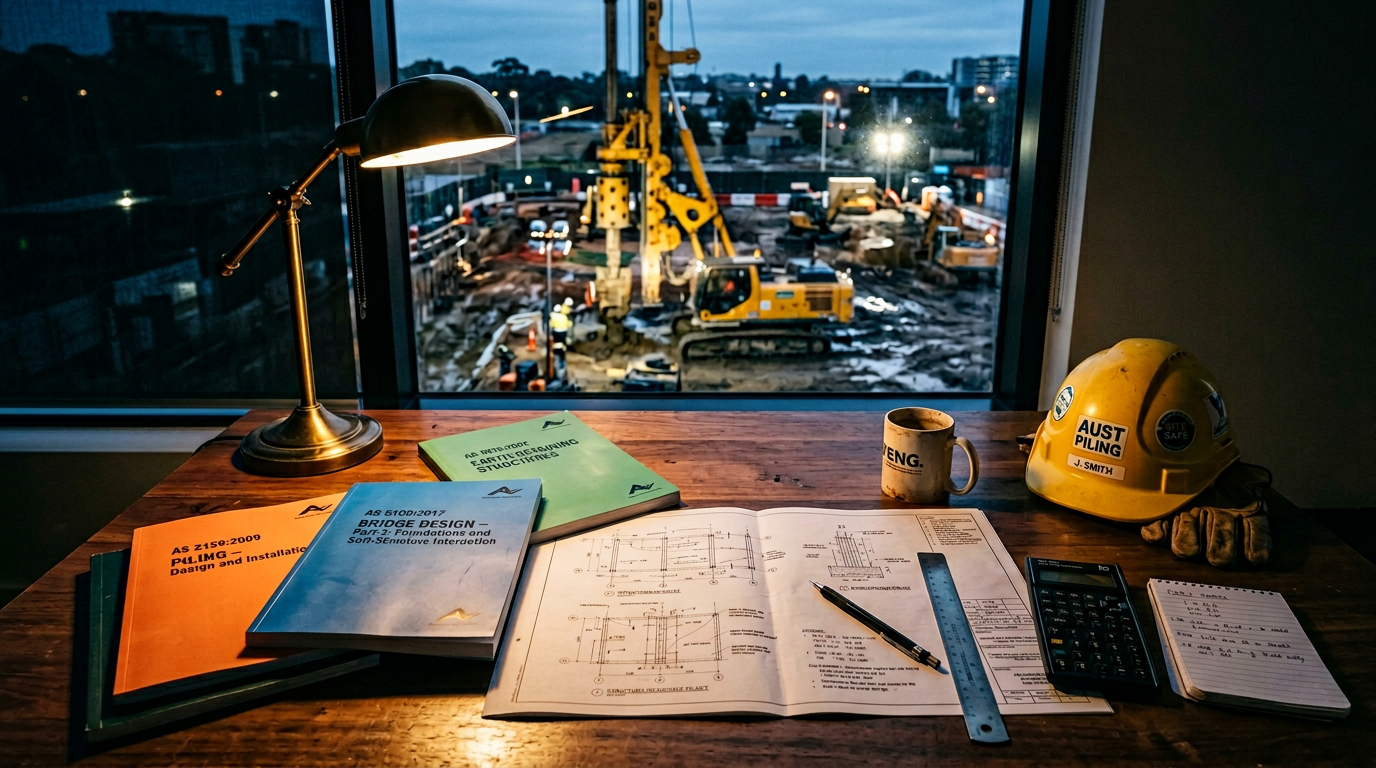
- Standards Australia, AS 5100.3:2017 Bridge design — Foundations and soil-supporting structures.
VIC PILING is a specialist piling contractor delivering tier-1 civil, energy, rail and commercial foundations across Victoria since 2016. Our principals bring 30+ years of combined design, installation and compliance experience under AS 2159, AS 5100 and AS 4678.